Perth ocean conditions.
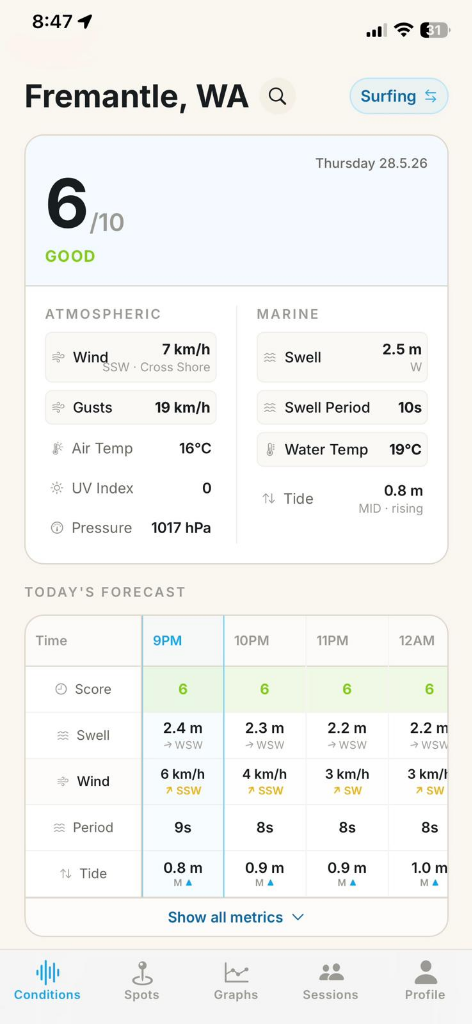
Wind, swell and tides tell part of the story. Fathom brings them together with local exposure, then scores the forecast for your activity.
See the live Perth outlookOr open the free web app to choose your own WA spot.
Start with a spot you know.
The live website outlook covers these five Perth coast spots. The app lets you explore more of Western Australia. At each spot, choose the activity before comparing scores.
- Cottesloe Beach conditionsWind, local swell, swell period and tides.
- Trigg Point conditionsA separate spot from Trigg Beach, with its own local exposure.
- Trigg Beach conditionsCheck the beach forecast for the activity you have selected.
- Leighton Beach conditionsCompare its score with nearby Port Beach in North Fremantle.
- Port Beach conditionsView the wind, swell and tide behind the current call.
A surf forecast is not a kite forecast.
Fathom scores nine activities: surfing, bodyboarding, kitesurfing, windsurfing, wingfoiling, stand-up paddleboarding, sailing, ocean fishing and land fishing. The forecast inputs may be the same, but the score changes with the activity.
Use the live outlook to compare two activities at one spot. In the app, start on Spots, choose your activity, then search for your usual beach. Open the spot to see the score alongside the conditions that produced it.
Why local swell matters in Perth.
The offshore swell forecast describes waves before local shelter is taken into account. Around Perth, Rottnest and the shape of the coast can change how much wave energy reaches a spot. Fathom separates the offshore swell from its estimate of local wave conditions.
The website outlook labels its wave source. Where a local wave model has coverage, it uses that result. Where coverage is missing, a simpler geometry estimate may be used. Missing measurements are shown as unavailable.
- Wind
- The forecast speed and direction at the selected spot.
- Local swell
- The wave-height estimate used for the spot, which can differ from offshore swell.
- Swell period
- The time in seconds between successive swell waves.
- Tide
- The tide state and whether it is rising or falling, when data is available.
Check now. Plan the week.
Start free on the web. Fathom Pro adds the full seven-day hourly forecast, swell shadow maps and tide graphs for planning further ahead.